|
Previous
Part - IX
APPENDIX
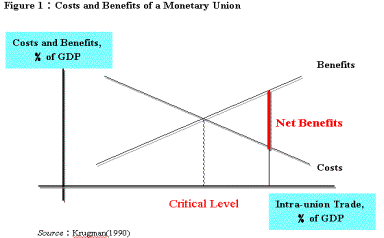
Figure 1

Table 1: 1983-1997 Correlation Coefficient of per Capita GDP
| |
Taiwan |
China |
Hong Kong |
| Taiwan |
1.0000 |
|
|
| China |
0.8978 |
1.0000 |
|
| Hong Kong |
0.9912 |
0.9304 |
1.0000 |
Source: Based on Statistics Department of Ministry, ROC, Asian Development Bank, Key Indicators of Developing Asian and Pacific Countries.
Table 2: 1998-2000 Correlation Coefficient of Per Capita GDP
| |
Taiwan |
China |
Hong Kong |
| Taiwan |
1.0000 |
|
|
| China |
0.9706 |
1.0000 |
|
| Hong Kong |
-0.4278 |
-0.1975 |
1.0000 |
Source: Based on Statistics Department of Ministry, ROC, Asian Development Bank?Key Indicators of Developing Asian and Pacific Countries.
Table 3: 1983-2000 Correlation Coefficient of Per Capita GDP
| |
Taiwan |
China |
Hong Kong |
| Taiwan |
1.0000 |
|
|
| China |
0.8879 |
1.0000 |
|
| Hong Kong |
0.9891 |
0.8989 |
1.0000 |
Source: Based on Statistics Department of Ministry, ROC, Asian Development Bank?Key Indicators of Developing Asian and Pacific Countries.
Table 4: 1983-1997 Correlation Coefficient of Money Supply (M2)
| |
Taiwan |
China |
Hong Kong |
| Taiwan |
1.0000 |
|
|
| China |
0.9359 |
1.0000 |
|
| Hong Kong |
0.9931 |
0.9636 |
1.0000 |
Source: Based on Statistics Department of Ministry, ROC, Asian Development Bank?Key Indicators of Developing Asian and Pacific Countries.
Next
* Contributed by -
Vipul Mittal,
First Year, MBA (Global),
IMT, Nagpur.
|
 |
 |
|